Justin Wedell, Associate Partner, NewSchools Venture Fund
In 2019, NewSchools partnered with Gallup to release “Education Technology Use in Schools,” a comprehensive report to better understand ed tech’s perceptions and usage. This past summer, we conducted a follow-up survey of parents, teachers, and students to evaluate how ed tech’s engagement may be changing in the pandemic context. We also surveyed how these groups feel about the coming school year and the supports they’ll need to be successful.
Some of our findings are particularly salient for ed tech innovators — those building and deploying the education technology upon which schools and families must rely. We’ve highlighted these findings because we feel they are the most relevant for innovators to consider as they develop new features and supports to empower parents, teachers, and students right now. Some of the findings remain aligned to our 2019 ed tech innovator takeaways, but most represent the demands of our new normal.
Top Ten Takeaways for Ed Tech Innovators
- Ed tech is still (obviously) everywhere, and teachers are here for it
- Middle and high school students are feeling more disengaged
- Personalized instruction is now the top priority across subjects
- Parents and teachers have different ed tech selection priorities
- Teachers are still the #1 most trusted resource when selecting ed tech, but the importance of evidence is rising
- For special education teachers, perceptions of ed tech’s effectiveness have dropped significantly during the pandemic
- Ed tech companies must do a better job providing support to a diverse user base
- Access to devices and bandwidth at home remains a challenge for some families
- Families’ biggest need isn’t device access; it’s clarity
- Ed tech companies must turn parents from detractors to promoters
1. Ed tech is still (obviously) everywhere, and teachers are here for it. In 2019, 81% of teachers saw great value in using ed tech tools and were even more optimistic (85%) about its future value. In 2020, teachers have become more positive on ed tech’s value, with 85% of teachers seeing great value using ed tech tools now and 90% seeing great value in using them in the future. Ed tech use was commonplace before the pandemic and rapidly becoming a standard part of the day-to-day education experience. With the onset of distance learning for many of our nation’s public schools, ed tech’s increased role has not yet dampened the positive perspective that most educators hold on its utility. How is your company building on this trust to better serve teachers in this moment?
2. Middle and high school students still want better, not just more, ed tech. Only about one in five middle and high school students would like to use ed tech less in the upcoming school year. Both groups’ desires for improvements in ed tech quality remain similar to those voiced in 2019. Middle schoolers’ top requests still include ed tech that’s more fun, interesting, and game-oriented. Only three in 10 middle schoolers say that school makes them want to learn more. Ed tech tools must rise to the occasion to better engage them.
High schoolers’ top requests still revolve around how ed tech might empower their learning, including better saving and organizing their work, tracking their learning progress, and interacting with their teachers more. Like middle schoolers, about three in 10 high schoolers agree that their schoolwork makes them want to learn more. Only 35% of high schoolers say they can connect what they’re learning in school to life outside the classroom, compared to 44% of high schoolers in 2019. How might your product, now and in the future, better meet these expectations?
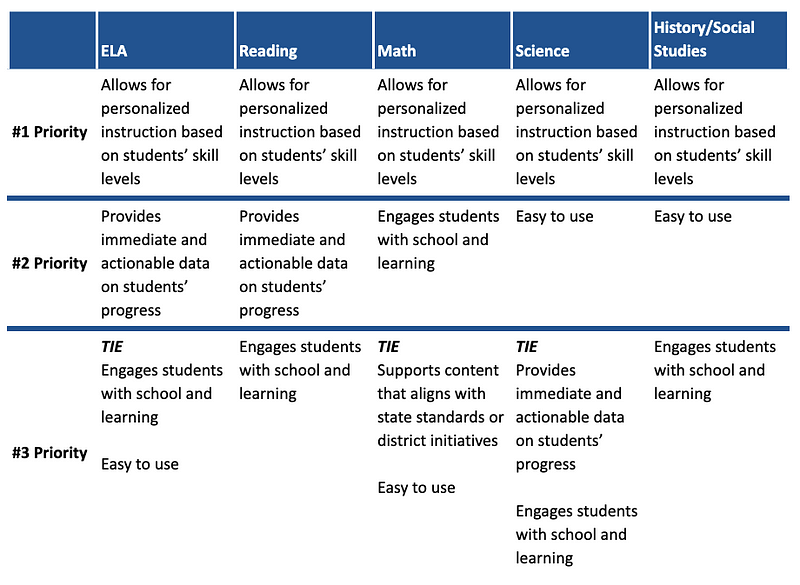
3. Personalized instruction is now the top priority across subjects. When reviewing teachers’ top selection priorities by subject, “personalized instruction” is now the number one selection criteria across all subjects. This is a departure from 2019, when personalized instruction was the top priority for core subjects, but not areas such as science and history/social studies. Except for reading, “easy to use” is also now present in the top three selection priorities for teachers across all subjects. How do your product and your messaging measure up against these priorities?
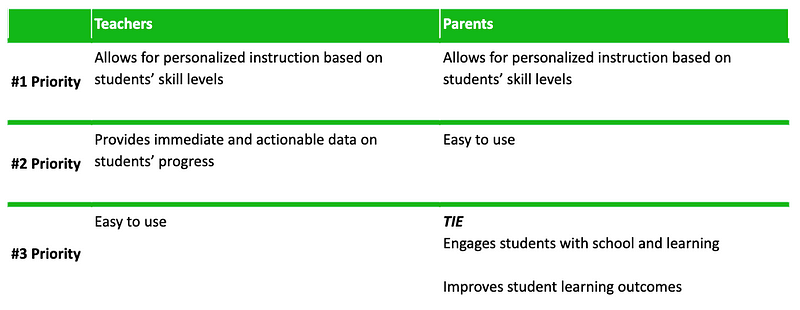
4. Parents and teachers have different ed tech selection priorities. Teachers and parents align on their top ed tech selection criterion — personalized instruction — , and both also look for products that are easy to use. However, whereas teachers are looking for tools that can provide immediate and actionable feedback, parents place more importance on student engagement and overall learning outcomes. How does your messaging and customer support align to these different user needs?
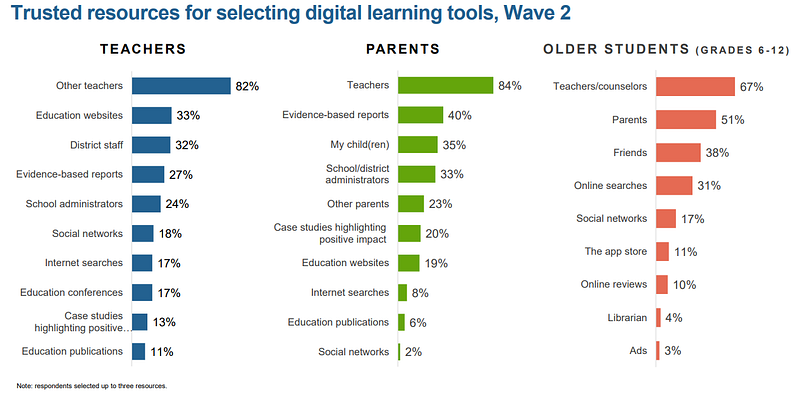
5. Teachers are still the #1 most trusted resource when selecting ed tech, but the importance of evidence is rising. Teachers still overwhelmingly rank “other teachers” as the most trusted source for helping them decide what ed tech tools to use. Parents and students also consider teachers to be their most trusted resource for selecting ed tech. However, a notable difference in 2020 is the rising importance of evidence for ed tech selection. Whereas only 18% of teachers cited evidence-based reports in 2019, they are now considered a trusted resource by 27% of teachers. Case studies have seen growth in esteem with the teacher populations and are now cited by 13% of teachers compared to only 6% in 2019. Parents, meanwhile, rely much more heavily on evidence-based reports and case studies than do teachers. How are you engaging teacher influencers in your focus area? How are you making your efficacy portfolio more visible and accessible?
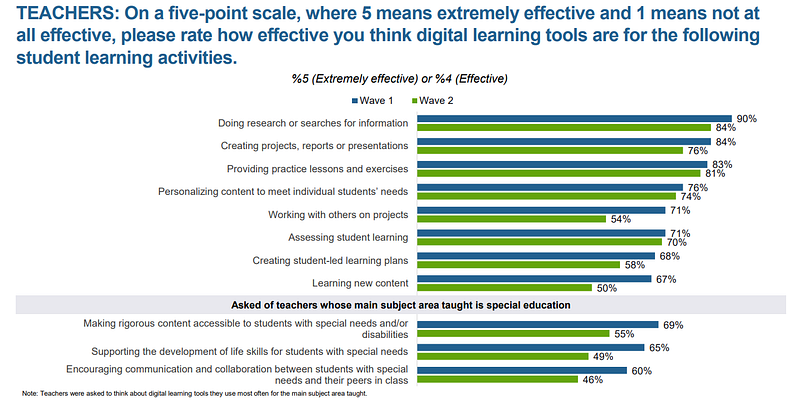
6. For special education teachers, perceptions of ed tech’s effectiveness have dropped significantly during the pandemic. Across the board, teacher perceptions of ed tech’s effectiveness dropped in 2020, signaling potential ed tech fatigue as well as a new understanding of ed tech’s limits in the context of the pandemic. These drops are most significant for teachers whose main subject is special education. When considering ed tech’s effectiveness in serving students with special needs or disabilities, teachers gave lower marks to digital tools’ ability to make content accessible, support the development of life skills, and encourage communication and collaboration with peers. What feedback have you received from your teacher users, and what are you doing to engage in equity-centered improvements?
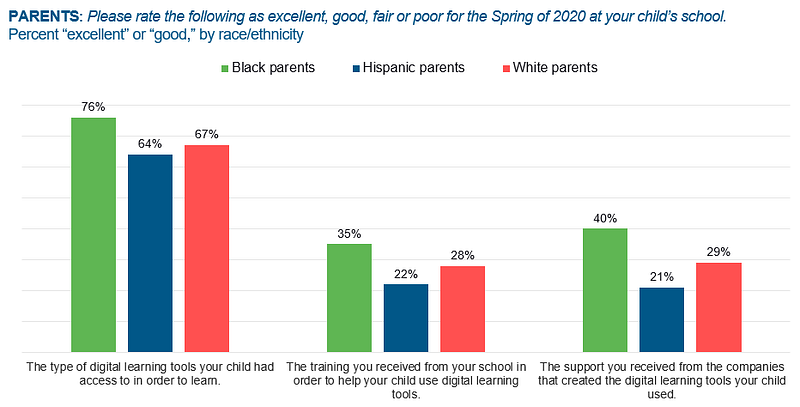
7. Ed tech companies must do a better job providing support to a diverse user base. When asked about the types of ed tech tools to which they had access, the majority of teachers, parents, and students considered them to be excellent or good. However, these positive perceptions broke down when respondents rated the quality of support they received from schools and ed tech companies to use these tools. Roughly a third of parents and students say that the support they received from ed tech companies was poor. Even more concerning are the differences that emerge when accounting for income and race. Students from low-income households and Latino parents and students were least likely to rate the support they received from ed tech companies as excellent or good. What are you doing to differentiate your customer support to amplify positive outcomes for all users?
8. Access to devices and bandwidth at home remains a challenge for some families. In 2019, we reported on the variability in device access within schools, which could make scaling in multiple schools/districts more challenging if your product doesn’t flex well to different access models. In the context of distance learning, we wanted to explore this challenge through the at-home lens. Eighty-one percent of parent respondents say their child has access to a family-owned computer to complete school work at home, while 35% say their child has access to a school-provided computer. These numbers shift, however, when accounting for household income. In lower-income households, only 68% of parents cite having access to a family-owned computer compared to 88% of parents in higher-income households. With regards to internet access, a similar story emerges. While 96% of parents in higher-income households say their internet is reliable-to-very-reliable, only 81% of parents in lower-income households say the same. How is your solution working to meet the needs of those families with more limited access?
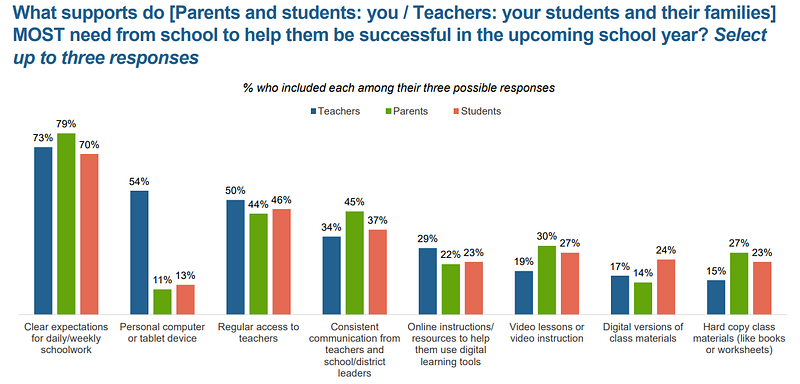
9. Families’ biggest need isn’t device access; it’s clarity. When asked what support their families and students most need to help them be successful in the upcoming school year, an overwhelming majority of teachers, parents, and students say “clear expectations for daily/weekly school work.” For parents and students, “consistent communication” and “regular access to teachers” round out their top three. While teachers rank device access as second-most important, it’s notable that it sits at the bottom of the list for parents and students — a potential reflection of that need for greater clarity and communication between the groups. How can ed tech companies facilitate more explicit expectations and dialogue between schools and families to support student success better this year?
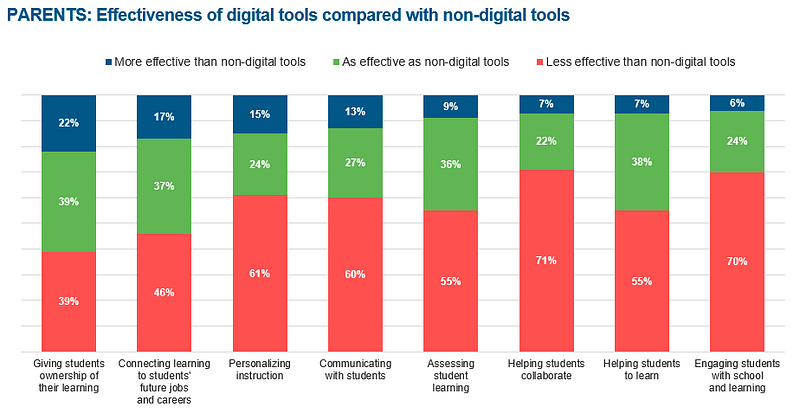
10. Ed tech companies must turn parents from detractors to promoters. While teachers and students have maintained relatively positive perceptions of ed tech and its role in high-quality teaching and learning, parents have a decidedly negative view. In six of eight indicators, the majority of parents say that ed tech is less effective than non-digital tools. This is emblematic of broader parent dissatisfaction with ed tech that emerged throughout the survey results. We hypothesize that the less-than-ideal onboarding experience for most parents to these digital tools is one of the driving factors here. As schools and families dig in for a long and uncertain future of distance learning this year, we wonder how ed tech companies might improve their products and their support to win over parent users.
For access to the report’s expanded findings, please visit the report’s homepage on our website. If you have any questions about the data or NewSchools, please contact Justin Wedell.