When the teachers of the year from across the country were asked in a Scholastic/Council of Great City Schools poll released recently what the biggest barriers are to their students’ academic success, it was no surprise that family stress and poverty topped the list. Students who experience physical or emotional abuse, caregiver substance abuse or mental illness, exposure to violence, or family economic hardship can suffer from “toxic stress,” which significantly limits the amount of learning possible in a classroom without adequate supports.
As an organization committed to transforming public education so it works for the most underserved students, we constantly ask ourselves: how do we know how well we are supporting our highest need students?
Common practice across the country is to use a student’s eligibility for the federal school Free and Reduced Priced Lunch program (FRL) as a measure of student poverty. Students can qualify with a family income that is less than 185% of the poverty line.
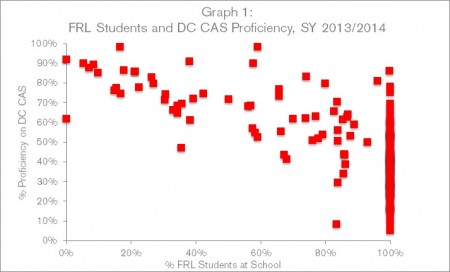
The graph below looks at academic achievement during school year 2013-2014 on Washington, DC’s standardized assessment—the DC Comprehensive Assessment System (DC-CAS)—relative to the percent of students who qualify for FRL. Here is what we and many others see in this picture (Graph 1):
- What’s exciting: The graph shows that there are schools with high numbers of low-income students that show very high achievement.
- What’s less exciting: The graph points out that schools with 100% FRL status students have widely different results for student achievement. Some schools with 100% FRL status students help their students achieve very high academic results, and others do not.
 Last year, DC began measuring student need by a new classification called “at-risk of academic failure.” This new classification started as a way to better allocate resources to the students most in need. To qualify as at-risk, a student’s family must receive Temporary Assistance for Needy Families, the Supplemental Nutritional Assistance Program, or be homeless, involved in the foster care system, or be a high school student who is over-age and under-credited. As a result, this classification gives us a more accurate picture of which students are facing acute challenges including hunger, homelessness, grief, violence, and other physical or emotional distress. Using this definition, we can get a better picture of what is going on behind the scenes for these students, and educators can support the specific needs of each student.
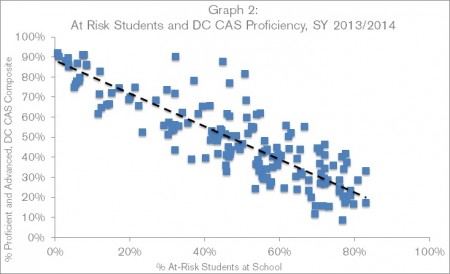
The second graph below (Graph 2) compares the percentage of at-risk students at a school with the overall level of student proficiency on DC-CAS. The picture changes to a tight correlation between acute student need and academic proficiency results – that is, the more at-risk students in a school, the lower the average student achievement. When we use this more precise measure, we can see that extreme poverty is very highly correlated with student achievement results.
This new way of measuring student need has sparked a lot of conversation in the DC education community. Are students better off in socioeconomically integrated schools? What’s happening in schools that are “beating the odds” with at-risk students? How do enrollment policies that vary between charter and district schools contribute to this picture?
We’ll keep sharing what we’re learning here, and we’d love to know what other cities learn as they seek more precise measures to understand student achievement for our most vulnerable students.